Jack Horton
Professor Patrick
Honors TPS Literature: Digital Humanities
16 February 2026
Data Project: Reflection
For this project, I did a six-day analysis on balancing my schedule, and I did a one-day analysis on my time alone. There were some things that I enjoyed and some things that I didn’t enjoy about collecting data about myself. What I didn’t enjoy was having to remember every hour of each day for nearly a week to jot down what I did on my notes app. However, what I did enjoy was writing the progress that I made because it boosted my confidence and self-esteem. What I also enjoyed was looking back on previous days on my schedule to look for pattern recognition, whether I do certain things at similar times or different times, what I did on Saturday that was completely different from what I did on Tuesday, etc. What this data illuminated was that I can have a fun, relaxing life while also remaining productive. I can go to class, do homework, eat well, go to the gym, work a part time job, and still have time to sleep, relax, have fun with friends, and have plenty of time to myself. What this data also illuminated was that whether I am alone, or with someone, whether that’d be friends, family, co workers, or associates, I am happy because I am in a comfortable spot. I have a roof over my head, both on and off campus, I have an on and off campus job as sources of income, I’m an honors student, I have the ability to dorm on campus, I have no debt, and I have very little in terms of responsibilities. When I think about all of this and realize that I am very fortunate, why would I bother thinking differently about being alone or being with others? As long as my interactions are good and I can be just as comfortable alone, I have no complaints. Some of the choices that I made that helped the process was setting reminders on my phone to write down my hourly schedule. Other choices that I made that helped the process was making sure I went to the gym five out of the six days, working over the weekend, and spending a good amount of time on my schoolwork, because this made my schedule productive, well balanced, and proud to reflect on. Another small detail that helped me was that I jotted down how I felt when I was alone, with people, and alone again on Friday in order to be able to reflect on the differences and similarities. However, some of the choices that I made that were poor were that I scrolled on my phone too much, I went to sleep at different times throughout the different days, and ate breakfast, lunch, and dinner at different times, which created some inconsistency and imbalance. However, while there was some imbalance, I was still able to get everything I needed to do despite the unproductive imbalances. Therefore, the balance outweighed the imbalance. Throughout this data project, I learned that I am inconsistently consistent. And what that means is that while I do everything spontaneously, I get my progress done at the end of the day, which helps keep my self esteem up. While it would be wiser to have an exact routine, it’s almost impossible to do that because I have different class schedules on different days and work at different times, and different physical feelings on different days. For example, one day I’ll feel tired, so I would make a decision to work out at night instead of the morning. While on another day, I’ll feel great and workout before my classes start. This data project made me remember an important life lesson. Life is hard, and life will always get in the way of your progress. The importance of life is figuring out how to work around your problems and be as productive as possible, whether you’re having the best day ever or the worst day ever. While I had some self reflections, this data project didn’t just give me realizations about myself. It gave me realizations about data as a whole and how much effort is put into data. While it may seem like a piece of cake at first, the more you do it, the more you realize how annoying it can get and how much skill and strong memory is required to be effective in data tracking. It also made me realize how hard people work who have to track data for a living, whether it’d be on celebrities, professional athletes, organizations, buildings, chains, cities, what have you. I also realized that learning how to data track is an essential skill to learn in order to prepare to live on your own because once you’re out in the real world by yourself, you are going to have to remember things that you didn’t even consider beforehand. And while the internet can be a reliable best friend, remembering essential skills and remembering to track things consistently not only grows your brain and skillset, but it also gives you a strong sense of pride. Overall, what I learned about data through this project was that it was the first step in the long process of my colleagues and I having successful futures.
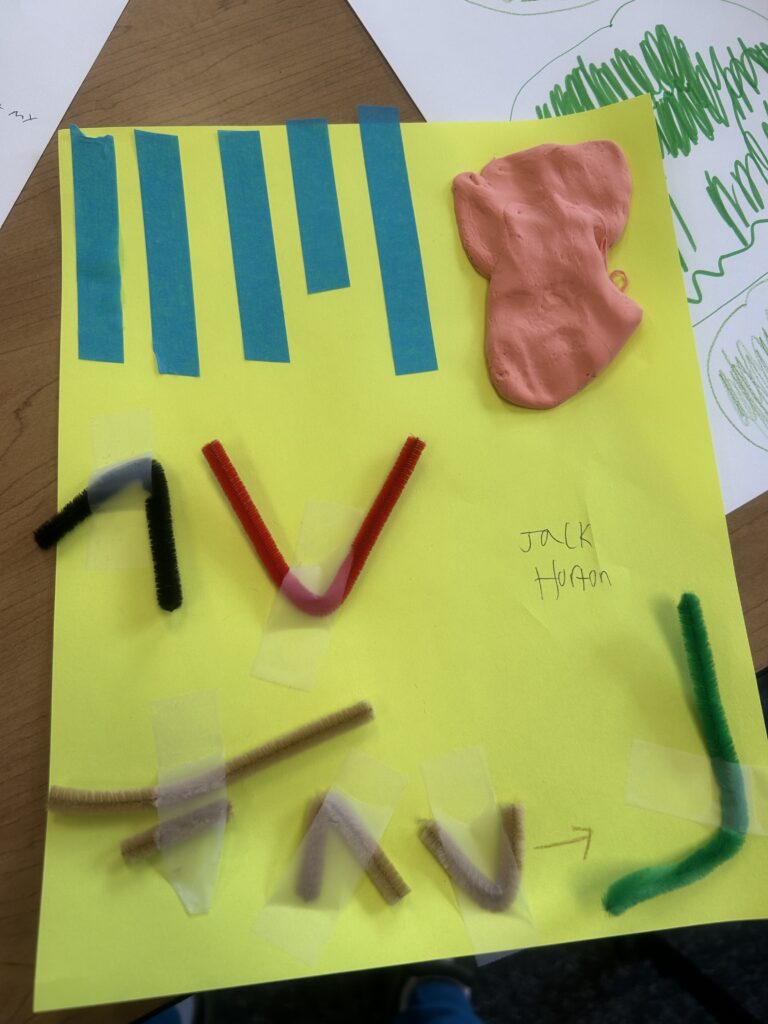
3D Visualization Explanation: Balancing My Schedule
The Blue Tape represents consistency and going to the gym five times a week. Tape ensures security, and much like security, my gym consistency is locked in and won’t change.
The Black and Red furry pipes represent my job.
The purpose of the black downward pipe is that working is a pain at first, but the red upward pipe means that it will get easier and much more tolerable as time goes on.
The Gold furry pipes represent schoolwork. Each gold pipe is different.
Long: Long Process
Small: Short Process
Downward: Not feeling good while working.
Upward: Feeling optimistic and focused while working.
Green Pipe: Check Mark
Purpose: No matter how long it takes or how I feel, I find a way to get my schoolwork done effectively.
Peach Clay: Represents social time
The big piece of clay means that even though I don’t do it much, whenever I hang out with friends, it’s eventful, unique, and well worth the time, just like clay.
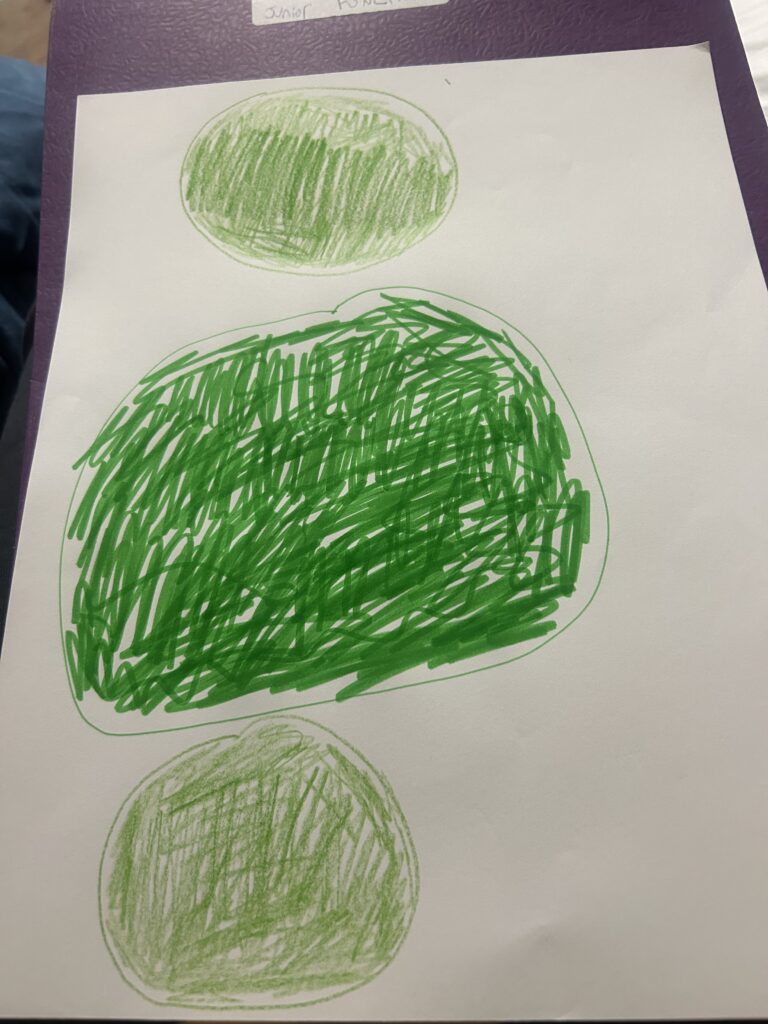
2D Visualization Explanation: My Time Alone
My 2D Visualization was recorded on Friday, February 6th. The 2 Green Circles represent the beginning and end of the day when I was alone. The one large green circle in the marker in the middle represents the big chunk of time from 3:00-11:00 PM when I was either with my mother, my friends, or other people. Why are they green circles? The green circles are there because just like how whether it’s in colored pencil or marker, the color is still green, it didn’t matter when I was alone, or with other people, I still had a good time and felt comfortable regardless of the situation.
Leave a Reply